iCIMS Analytics Dashboard: What to Track and How to Configure It
Most recruiting teams have access to powerful iCIMS reporting – but half of them aren’t using it right. Here’s what to actually track, and how to set it up properly.
Talk to an iCIMS ConsultantYour iCIMS analytics dashboard is one of the most underused tools in the entire platform. We see it constantly – teams who log in every day to manage requisitions and move candidates through workflows, but never open the Reporting and Analytics tab. Or worse, they open it, see a wall of charts, and close it again. That’s a real problem. Because the data is there. iCIMS tracks everything you need to diagnose hiring bottlenecks, evaluate source quality, and show leadership what recruiting actually costs the business. You just need to know what to look for – and how to configure your view so it surfaces the right things.
This guide covers the five metrics that matter most, how to configure role-based dashboards for recruiters and hiring managers, and the most common mistakes that make reporting feel harder than it needs to be.
📋 Table of Contents
- What Most Teams Get Wrong About iCIMS Reporting
- The 5 Metrics Your iCIMS Analytics Dashboard Should Always Show
- How to Configure Your iCIMS Analytics Dashboard (Step-by-Step)
- Setting Up Role-Based Dashboards
- Dashboard Mistakes That Kill Insight
- iCIMS Analytics for Executives vs. Recruiters
- Frequently Asked Questions
🔥 What Most Teams Get Wrong About iCIMS Reporting
The mistake isn’t that teams ignore reporting entirely. It’s that they treat iCIMS dashboards like a static view – check it once a month, screenshot it for a deck, then forget about it until next month’s leadership review.
That’s not how iCIMS analytics is designed to work. The platform’s dashboards are meant to be a live operating layer – something recruiters reference daily, hiring managers check weekly, and executives use to evaluate pipeline health in real time. When it’s set up well, your iCIMS analytics dashboard tells you which roles are getting stuck, where candidates are dropping off, and whether your job boards are actually worth what you’re paying for them.
When it’s not set up well, you get a handful of generic charts that don’t connect to how your team actually works. The data is accurate. The problem is that no one configured it to answer the right questions.
📊 The 5 Metrics Your iCIMS Analytics Dashboard Should Always Show
There are dozens of metrics iCIMS can surface. Most teams don’t need dozens – they need five core metrics configured in a way that maps to their actual hiring process. Here’s what we recommend to every iCIMS client we work with.
Time-to-Fill
By role, recruiter, and department. Averages hide problems – segment this or it’s useless.
Source Effectiveness
Which channels produce applicants who actually get hired, not just apply.
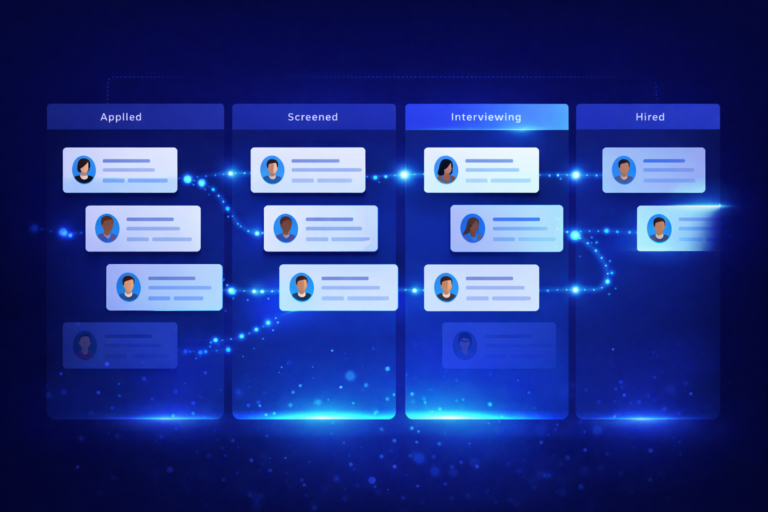
Pipeline Conversion Rate
Stage-by-stage drop-off. This is where hiring bottlenecks live.
Offer Acceptance Rate
A low OAR is an early warning for comp gaps or a broken candidate experience.
Recruiter Activity Volume
Outreach, screens, and dispositions per recruiter. Useful for capacity planning.
Time-to-Fill – Segment It or It’s Useless
Time-to-fill as a single company-wide number is mostly noise. A team averaging 32 days to fill might look fine until you realize engineering is at 60 days and entry-level ops roles are at 11. iCIMS lets you slice time-to-fill by recruiter, job family, department, and location. Set up a widget for each of those views – not just a global average. That’s where you’ll actually find the problem.
Source Effectiveness – Don’t Just Measure Applicants
This one trips up a lot of teams. They configure source tracking to count where applications come from – which is fine – but they never connect source data to actual hires. An Indeed posting that pulls 400 applicants but converts 0 to offer is worse than a LinkedIn posting that pulls 40 applicants with 8 hires. iCIMS tracks this full funnel by source. Use it.
iCIMS’s Spring 2026 product release added automatic source attribution across inbound, outbound, and CRM-driven sourcing channels in iCIMS CXM. If your team uses iCIMS Engage, check whether this feature is enabled – it makes source effectiveness data significantly more accurate without any manual tagging.
Pipeline Conversion Rate – The Real Bottleneck Detector
If you want to know why hiring is slow, look at where candidates stop moving. Pipeline conversion rate tracks the percentage of candidates who advance from each stage to the next. A low screen-to-interview conversion might mean your job descriptions are attracting the wrong candidates. A low interview-to-offer rate might mean interview panels have inconsistent criteria. iCIMS surfaces this at the workflow stage level. You just have to build the view.
Offer Acceptance Rate – A Leading Indicator, Not a Lagging One
Most teams treat offer acceptance rate as something that shows up after a problem has already happened. We think of it differently – as an early warning system. If OAR starts dipping, even slightly, it usually signals something earlier in the funnel: a misaligned comp expectation, a slow offer process that’s letting candidates accept elsewhere, or a candidate experience problem that’s building frustration before the offer stage. Tracking it in real time means you can catch and correct the issue faster instead of discovering it in a quarterly review.
Recruiter Activity Volume – Capacity Planning Before Burnout Hits
This metric doesn’t get enough attention. Recruiter activity volume – how many screens, dispositions, and outreach touchpoints each recruiter is handling per week – tells you who is overloaded before they start dropping balls. It’s not about micromanagement. It’s about knowing when a team member needs backup before requisitions start going stale.
Not Sure What Your iCIMS Dashboard Should Show?
We help iCIMS teams configure reporting and analytics that actually map to how their business hires. Let’s talk through your setup in a free working session.
Book a Free Consultation⚙️ How to Configure Your iCIMS Analytics Dashboard (Step-by-Step)
iCIMS doesn’t have a single dashboard you turn on – it’s a configurable reporting layer you build to fit your team. Here’s how to approach the setup methodically, whether you’re starting from scratch or cleaning up an existing configuration.
- 1
Access Reporting and Analytics
The Reporting and Analytics module in iCIMS is your central hub for both dashboards and saved reports. The exact navigation depends on your configuration, but it’s typically accessible from the main sidebar or navigation bar. Your admin controls who sees what here through login group permissions. If you can’t access the full module, that’s the first thing to resolve.
- 2
Add Widgets That Match Your Role
iCIMS dashboards are built from configurable widgets – panels that display specific data views. For recruiters, start with: open jobs summary, candidates by stage, task queue, and a time-to-fill trend for your assigned roles. For hiring managers, start with their jobs’ pipeline summary and a snapshot of candidates awaiting their action. Don’t over-build to start. Five to seven well-chosen widgets beat twenty cluttered ones every time.
- 3
Set Widget Date Ranges Deliberately
One of the most common dashboard problems we diagnose: widget date ranges that don’t match what the user is actually trying to measure. Rolling 30-day windows work well for operational metrics like pipeline health. Rolling 90-day or year-to-date windows work better for trend metrics like time-to-fill and source effectiveness. Check every widget you add. They don’t all default to the same range, and mismatched windows produce misleading comparisons.
- 4
Create and Save Custom Reports
For any metric you review regularly – especially for leadership presentations – build a custom report, apply your filters, and save it to the shared library. Recruiter admins can share saved reports at the organization level, so your whole team works from the same version of the data. This eliminates the “everyone is pulling different numbers” problem that kills trust in recruiting data faster than anything else.
- 5
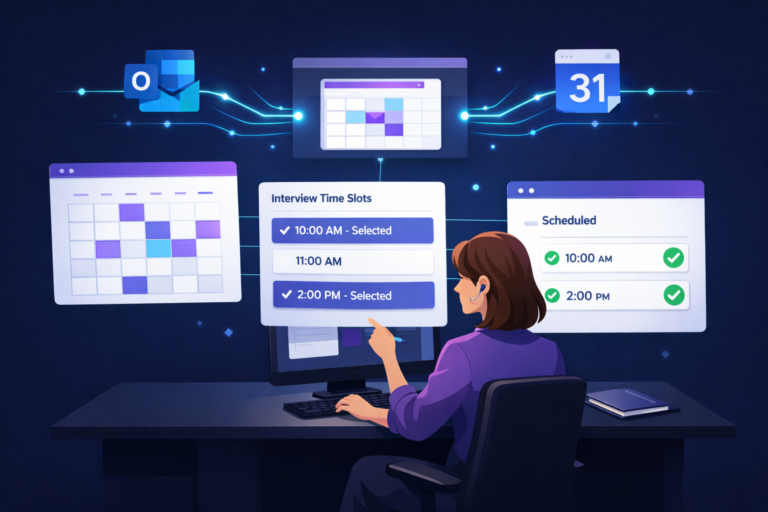
Schedule Recurring Report Delivery
Set up scheduled delivery for your key reports – especially time-to-fill summaries and source effectiveness views. Sending a weekly recruiting snapshot to hiring managers and leadership keeps them informed without requiring them to log into iCIMS to pull data themselves. It also reduces the number of “can you send me the latest hiring numbers” requests your team fields every week, which is a real time drain.
👥 Setting Up Role-Based Dashboards in iCIMS
One dashboard for everyone is a dashboard for no one. iCIMS supports role-based dashboard templates that you can apply at the login group level, which means every new user in a given role inherits the right view automatically. This is one of the highest-leverage configuration changes you can make for a team of any size.
| Audience | Key Metrics to Show | Dashboard Focus |
|---|---|---|
| Recruiter | Open jobs, candidate queue, task list, time-to-fill per assigned role | Operational |
| Hiring Manager | Candidates by stage on their open jobs, action items awaiting response | Action-Oriented |
| Sourcing Specialist | Source effectiveness, CRM engagement rates, talent pool health | Pipeline Building |
| TA Leader / Executive | Time-to-fill trends, OAR, hiring velocity by department, recruiter activity | Strategic |
🚫 Dashboard Mistakes That Kill Insight
We’ve audited a lot of iCIMS setups. The same reporting problems show up over and over. Here are the five we see most often – and what to do about each one.
Tracking applications instead of hires by source
Reconfigure source widgets to show conversion-to-hire, not just application volume. High applicant counts from a source that never produces hires is a budget drain you can actually see in your data – if you look at the right metric.
Inconsistent disposition codes breaking pipeline data
Pipeline conversion metrics are only accurate if candidates are consistently dispositioned at each stage. Audit your team’s dispositing habits and standardize through workflow automation where possible. A candidate moved informally without a disposition code is invisible to your analytics.
Date range mismatch between widgets
Check every dashboard widget’s date range setting after you add it. Different defaults across widgets mean you’re often comparing data from different time periods without realizing it. This is one of the most common reasons dashboard numbers don’t match what recruiters see in their queues.
Building dashboards nobody actually refers to
If you build a dashboard and nobody looks at it in day-to-day work, the design is wrong – not the people. Start with the questions recruiters and hiring managers are already asking and build dashboards that answer those specific questions. Work backward from the question, not forward from the data.
No scheduled reports for leadership
Leadership doesn’t log into iCIMS. If they’re only seeing recruiting data when you pull it manually for a presentation, you’re always reactive. Set up automated weekly or bi-weekly delivery so leadership sees trends before they become problems, and so recruiting gets credit for the work it’s doing.
🎯 iCIMS Analytics for Executives vs. Recruiters
The biggest difference between an executive-facing analytics view and a recruiter-facing one isn’t the data – it’s the time horizon and the level of detail. Recruiters live in the day-to-day: which candidates need action, which roles are behind pace, which tasks are overdue. Executives care about trends: is hiring velocity improving? Are we on track to meet headcount targets? What’s cost per hire trending toward this quarter?
iCIMS can support both audiences well. But you have to configure the views separately. Executive dashboards should pull back to department-level and company-level summaries. Recruiter dashboards should surface individual-level task queues and role-specific pipeline data. Mixing the two – giving everyone the same dashboard – means nobody gets what they actually need.
One thing we recommend to every TA leader we work with: set up a monthly “TA Insights” report that summarizes the five core metrics we covered earlier, segmented by department. Schedule it to go out automatically on the first Monday of every month. It takes about an hour to configure once and then runs itself. It’s consistently one of the changes that has the biggest impact on how leadership perceives the recruiting function – because it makes the work visible on a regular cadence.
❓ Frequently Asked Questions
Ready to Get More From Your iCIMS Analytics?
We work with recruiting teams to configure iCIMS dashboards and reports that actually get used. If your team is logging in and guessing, we can fix that in a single working session.
Book a Free iCIMS Consultation