
monday.com Dashboard
Consultant
Most monday.com dashboards show data nobody trusts. We build real-time reporting setups that give your team actual visibility — so you can stop exporting to Excel and start making decisions from monday.
The Problem
Your monday.com dashboards probably aren’t telling you anything useful.
It’s not a monday.com problem — it’s a setup problem. Dashboards are only as good as the boards and columns feeding them. If the underlying data is messy, the dashboard will be too. We fix it at the source.
You’re still exporting to Excel
The dashboard exists but nobody trusts it, so the team exports every Monday morning and rebuilds the report manually.
Numbers that don’t add up
Your widgets show totals that make no sense — wrong boards connected, wrong columns selected, or filters pulling the wrong data.
Widgets nobody uses
The dashboard was set up once, looked good in the demo, and never got updated. Now it’s ignored because it doesn’t reflect how the team actually works.
No cross-team visibility
Each team has their own board but leadership can’t see a combined view — so reporting still happens in slides and spreadsheets every week.
What Good Looks Like
A dashboard that answers real questions — at a glance.
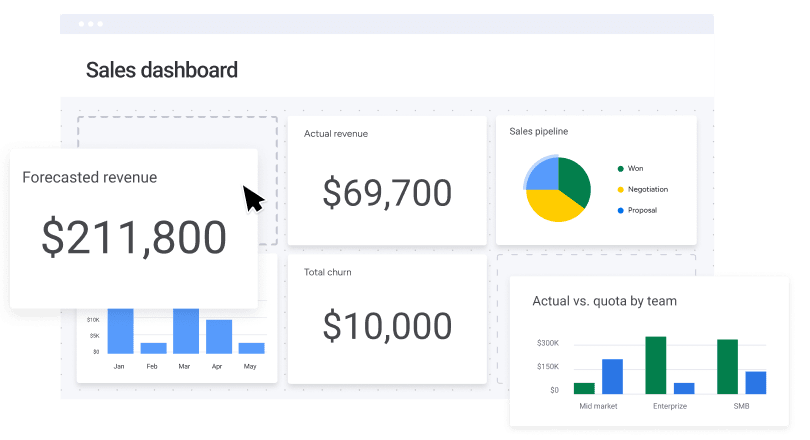
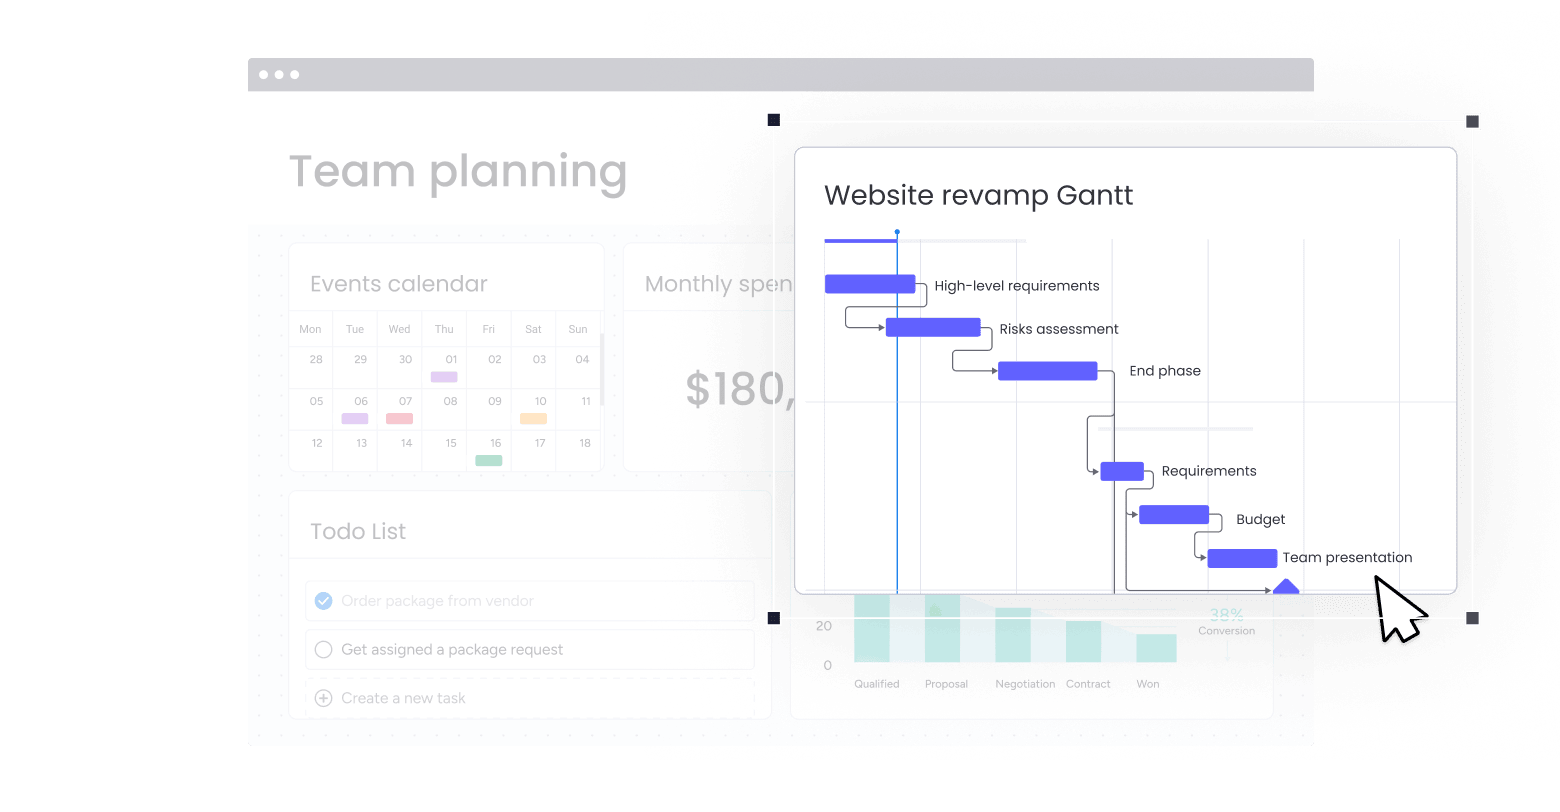
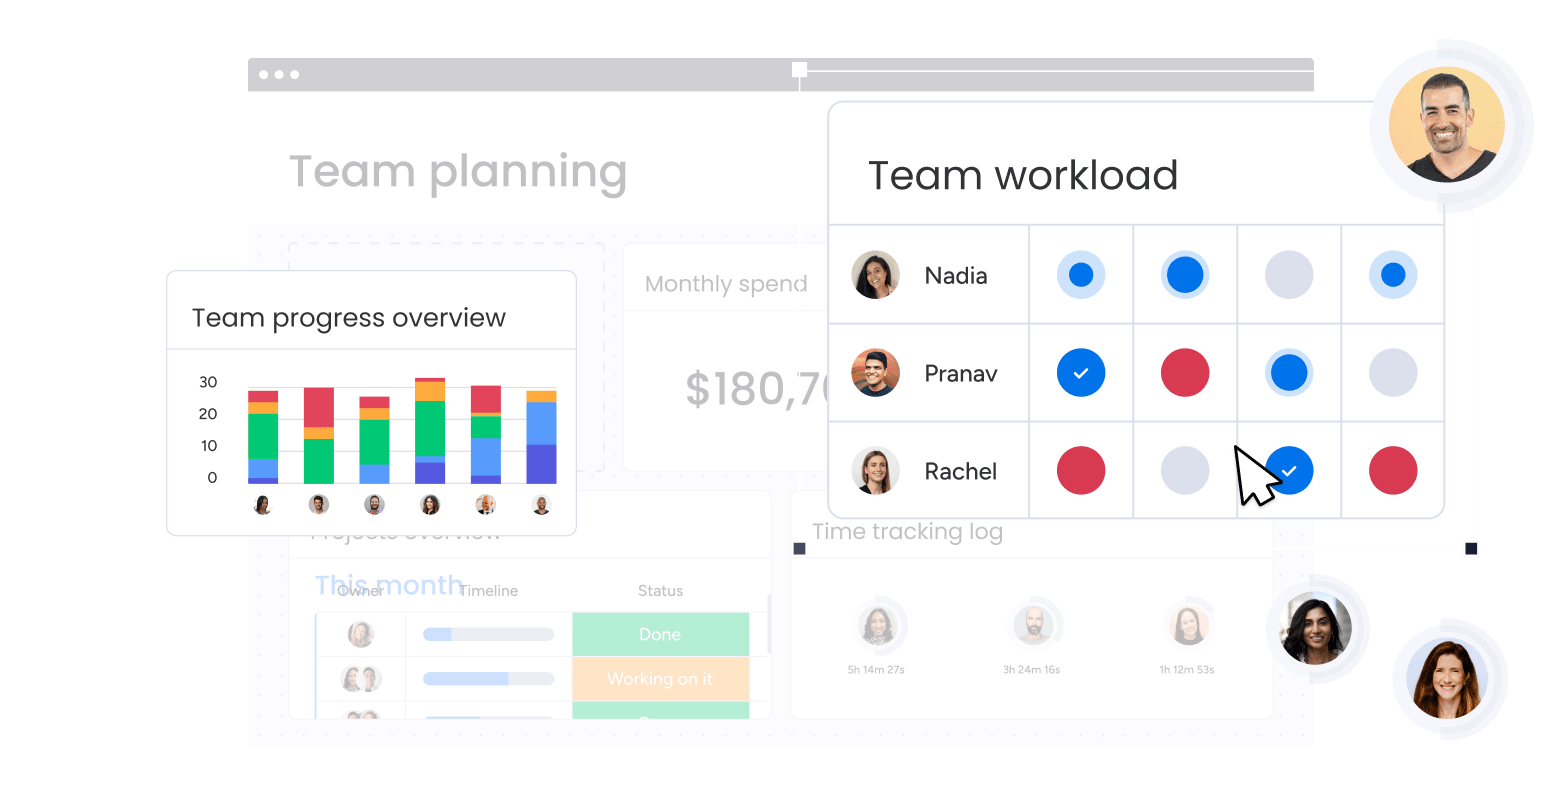
We build monday.com dashboards around the questions your team actually asks every week — budget vs. actual, workload distribution, project status across teams, and more.
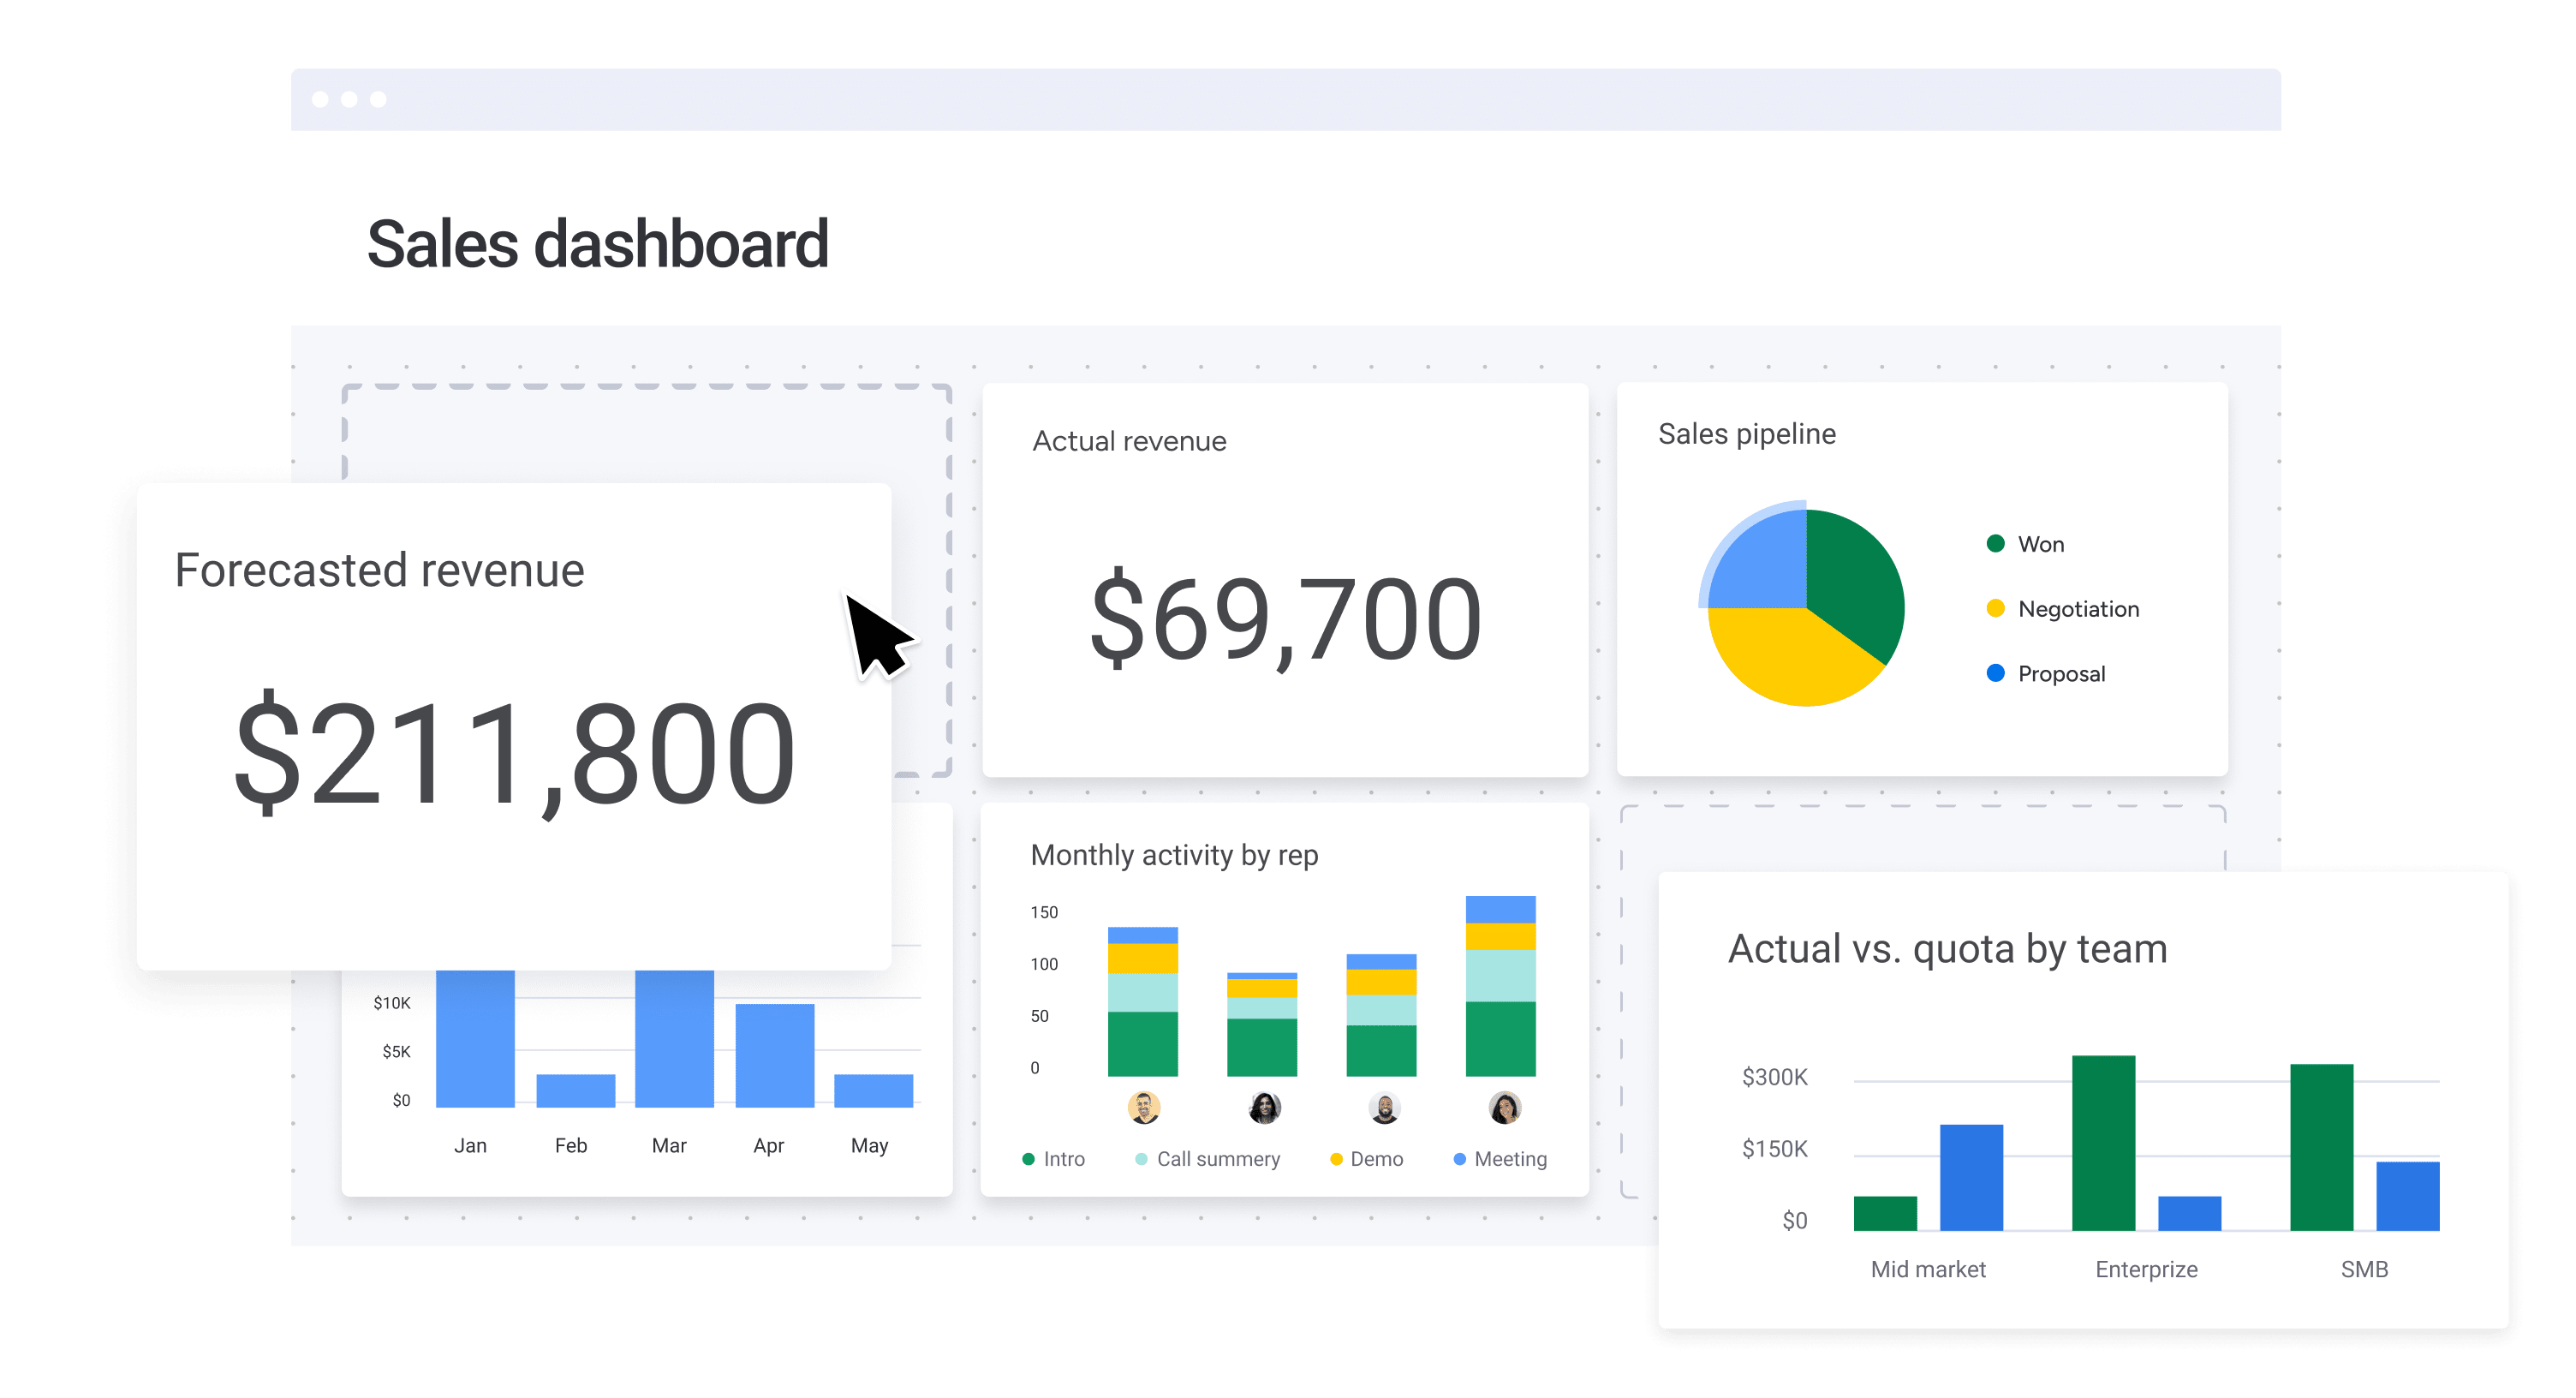
Example monday.com dashboard — Numbers, Charts, Battery and Workload widgets working together.
What We Do
Four ways we make your monday.com
dashboards actually work.
Whether you’re starting from scratch or fixing something broken, we scope the work around what you actually need.
Dashboard Builds from Scratch
For teams that need a proper reporting setup and don’t have one. We design dashboards around your specific KPIs — connecting the right boards, picking the right widgets, and making sure the data you see is the data you need.
- KPI and reporting requirements scoping
- Board structure setup for clean data flow
- Widget selection and configuration
- Multi-board and cross-team dashboards
Dashboard Audits & Cleanup
For teams with dashboards that aren’t working. We review your existing setup, find out why the numbers are wrong, fix the board logic causing bad data, and rebuild the widgets so they actually reflect what’s happening.
- Audit of existing dashboards and widgets
- Root cause analysis for data issues
- Board and column fixes to correct data flow
- Rebuilt widgets with accurate, reliable data
Reporting Strategy & Training
A great dashboard nobody knows how to read is just decoration. We run live training on how to use your new dashboards, and help your team build the habits that keep the data clean and the reports trustworthy.
- Live dashboard walkthroughs (remote or on-site)
- Data hygiene best practices
- Reporting cadence recommendations
- Written documentation and SOPs
The Toolkit
Every monday.com widget — configured right.
We know which widgets work for which use cases, how to feed them clean data, and how to arrange them so leadership actually opens the dashboard.
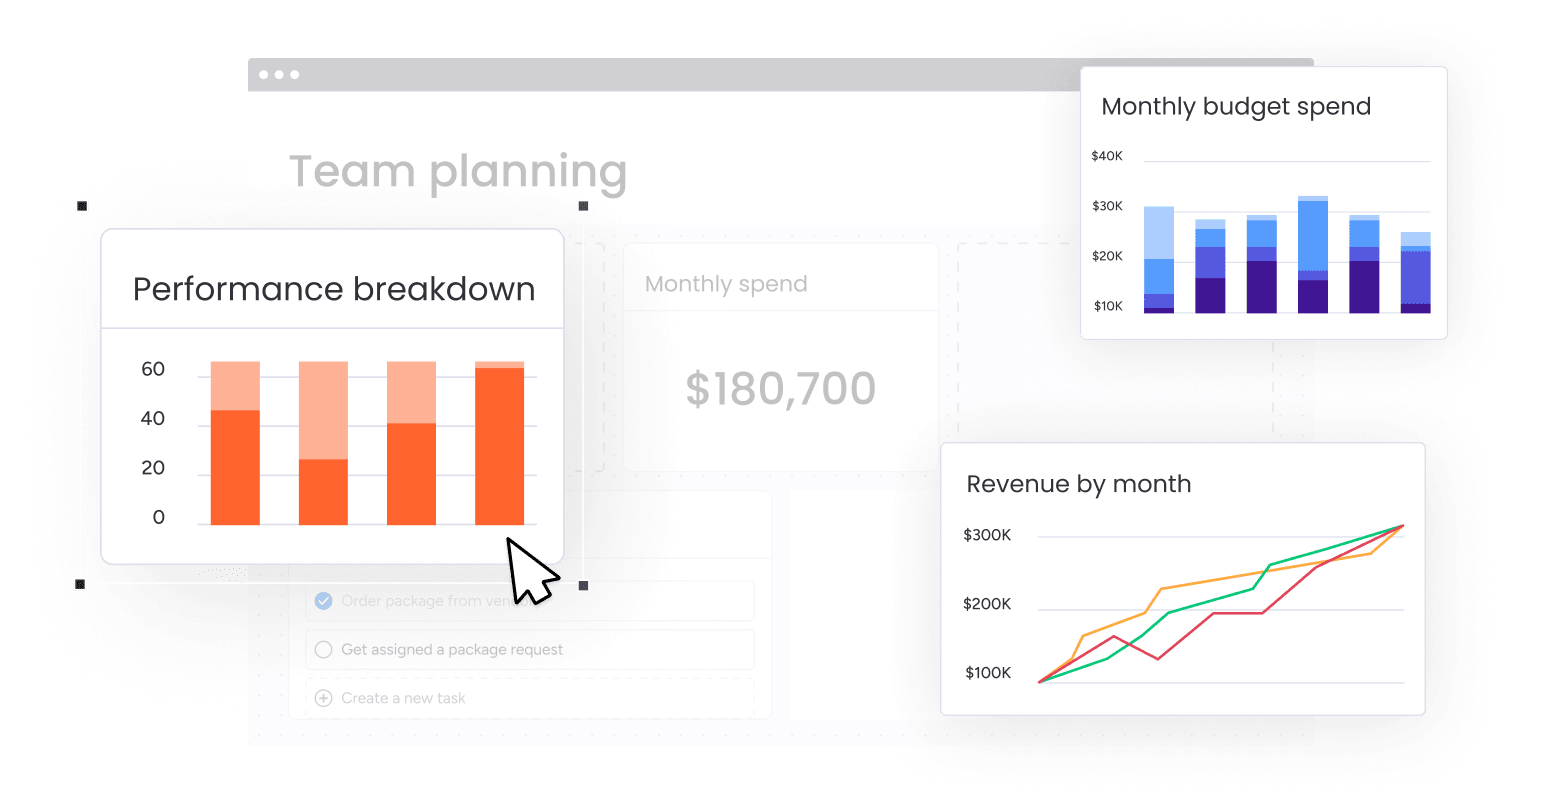
Charts Widget
Bar, line, and pie charts for tracking trends, comparing performance across teams, and surfacing patterns in your data over time.
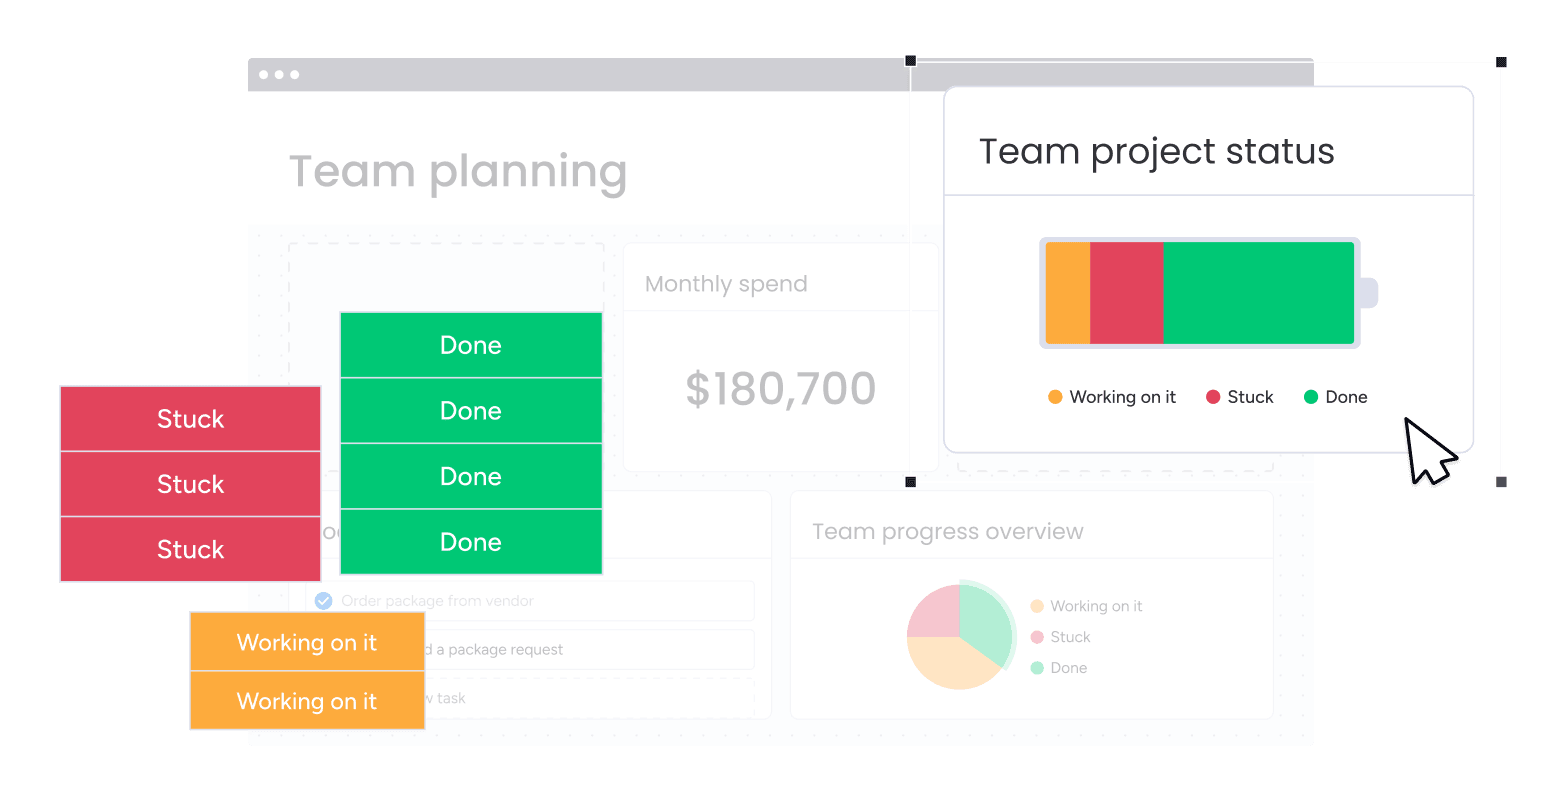
Battery Widget
At-a-glance status overview — see how much of your work is Done, In Progress, or Stuck without clicking into a single board.
Numbers Widget
Show totals, averages, sums, or counts for any numeric column — tasks completed, budget spent, hours logged, deals closed.
Gantt Widget
Timeline view of all your projects and tasks — perfect for spotting scheduling conflicts, resource bottlenecks, and deadline risk.
Workload Widget
See who’s overloaded and who has capacity — visualized across your whole team so managers can reassign work before things fall behind.
Time Tracking Widget
Aggregate time logs across boards and team members — great for client billing, capacity planning, and understanding where hours actually go.
Widget screenshots from monday.com’s Dashboards feature page. 50+ widgets available — we’ll recommend the right ones for your use case.
The Process
From scattered data to a dashboard your team checks every morning.
Week 1
Discovery
We map your current reporting setup, understand the questions your team needs to answer, and audit the boards feeding your dashboards.
Week 2
Blueprint
We map out exactly which dashboards to build, which widgets to use, and which board fixes are needed to make the data flow cleanly.
Weeks 2–3
Build
We fix the underlying boards, set up the dashboards, configure every widget, and test with real data until the numbers are accurate and the layout is clear.
Week 4
Train & Hand Off
Live walkthrough with your team — how to read the dashboards, how to keep the data clean, and how to request changes as your reporting needs evolve.
Timeline shown is for a standard dashboard engagement. Scope varies based on the number of dashboards, the complexity of your board structure, and whether board cleanup is included. We’ll give you a clear estimate after a discovery call.
Why FlowFam
We don’t just add widgets.
We fix the data behind them.
Most dashboard projects fail because the underlying board structure wasn’t designed for reporting. We work from the ground up — boards, columns, automations, and then dashboards.
We start with board structure, not widgets
A dashboard is only as good as the data feeding it. We fix the underlying board logic first so every widget pulls clean, accurate data.
We build around your actual questions
Before we touch a widget, we ask: what decisions does this dashboard need to support? Every build starts with your reporting goals, not with monday.com defaults.
We make dashboards teams actually use
A dashboard nobody checks is wasted effort. We design for clarity and habit — the layout, the refresh cadence, the training — so your team opens it by default.
“We had dashboards — they just showed nothing useful. FlowFam figured out in the first call that our column setup was the problem, not the widgets. After the engagement our weekly ops review went from a 45-minute Excel session to a 10-minute monday.com check-in.”
FAQ
Common questions about monday.com dashboards.
What does a monday.com dashboard consultant actually do differently from monday.com support?
monday.com support can tell you how a widget works. We figure out why your dashboard isn’t showing the right data, fix the board structure causing the problem, and rebuild the whole reporting setup around what your team actually needs to see. It’s the difference between product documentation and a hands-on build.
Our boards are a mess. Can we still get good dashboards?
Yes — but we’ll need to fix the boards first. Dashboard data is only as clean as the boards feeding it. If your boards have inconsistent column usage, missing data, or poor structure, we’ll address that as part of the engagement before building out the dashboards. We include board cleanup in our scoping conversation.
How long does a dashboard engagement take?
A standard dashboard engagement runs approximately 4 weeks from kick-off to handoff. The timeline depends on how many dashboards you need and how much board cleanup is required. We give you a clear project estimate after the discovery call.
We’re evaluating monday.com — can dashboards actually replace our Excel reports?
For most teams, yes — if the setup is done right. monday.com dashboards can replace weekly Excel exports, status slide decks, and manual reporting, as long as your boards are structured to capture the right data. We help teams evaluate that fit during the discovery call, and can show you examples of what’s possible before you commit.
Which plan do we need for dashboards?
Basic dashboards are available on the Standard plan, but connecting multiple boards requires Pro or above. Enterprise adds additional governance and permissions. We’ll review your current plan during the discovery call and flag any plan-level constraints that might affect what we can build — before any work begins.
What happens after the engagement ends?
You’ll have dashboards that work, documentation on how to maintain them, and a trained team. If you want ongoing support — for new boards, changing KPIs, or quarterly reporting reviews — we offer retainer arrangements. Many clients move to a monthly check-in model after the initial build.
Your data is already there.
Let’s make it visible.
Book a free 30-minute discovery call and we’ll review your current setup, understand your reporting goals, and tell you exactly what it would take to get dashboards your team actually uses.
Book a Free Consultation →No commitment required. Free 30-minute discovery call.